Because cryptocurrencies are relatively-new trading instruments, most of the new people that want to trade them believe that some different indicators should be created in order to apply technical analysis principles.
However, since the price of cryptocurrencies fluctuates based on the underlying order flow, meaning the supply and demand variations push prices up and down, technicians can develop methods to trade crypto like they do with stocks, commodities, and other instruments. In the current material, we’ll discuss a particular setup, called the moving average pullback.
Why the 200 simple moving average?
In technical analysis, the 200 simple moving average is widely regarded as a separation zone between bearish and bullish territory. It represents a dynamic support or resistance level, which is right what a trader needs in order to trade in the dominant direction of the market.
Although it is assumed that the daily 200 MA is the most important, if we do a little bit of research, it turns out that the MA works even on smaller time frames, as you can see in the chart below.
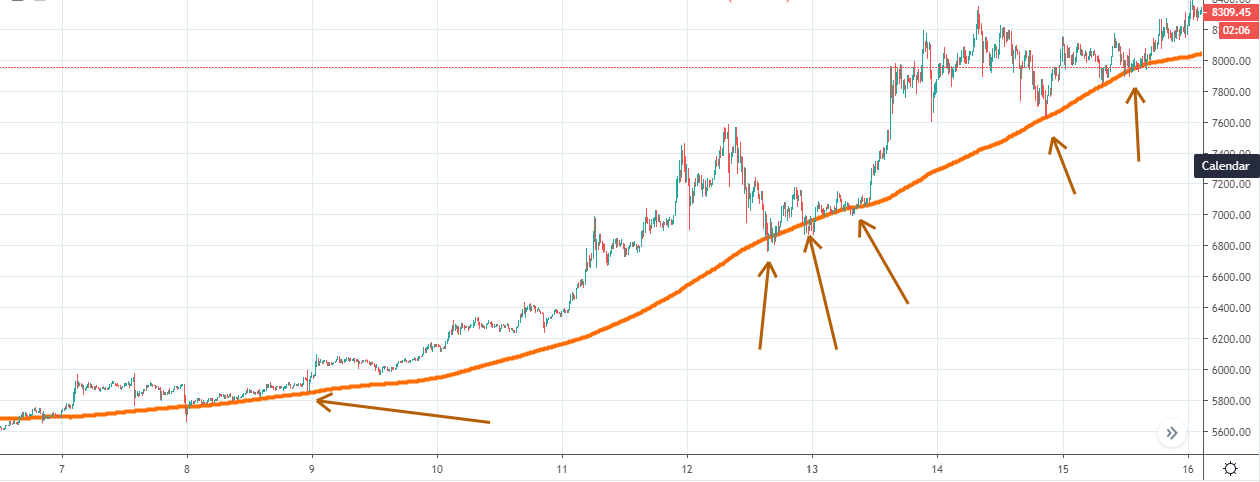
Above we have the chart of Bitcoin on the 15 minutes time frame. Even though the chart covers less than 2 weeks of price activity, we can easily spot more than 6 times the price retraced towards the 200 moving average.
Trading with moving averages is popular on many online courses, even on MGC Logic Trading Academy. However, like any other trading system, this one also can provide false signals. In order to filter them out, we must set some rules in place.
First and foremost, one can only trade this setup when the market had a clear dominant direction. In our chart, Bitcoin was clearly in a bull run and the retracements to the MA were opportunities to rejoin the trend. Spotting the direction of the market can be done easily by analyzing a chart on a higher time frame, or by looking at the direction of the impulsive moves.
Second of all, we must notice that there’s a relation between price and the moving average. If we look at the left side of our chart, we could see how the price was treating the MA as support. The pattern continued as the price climbed, offering several opportunities to get long.
Lastly, the system should be used on large-cap cryptocurrencies, since the biggest liquidity can be found there. Focusing on those tokens will mean you will trade where most of the market participants are putting their money and it will also mean that false signals will be less due to the increased liquidity.